As a digital marketing consultant, I rely heavily on clickstream analysis tools, like Google Analytics, to gain actionable insight for my clients.
Data from these reports allows me to review which channels, devices, and campaigns are driving new leads, and where to best allocate time and marketing budget. While Google Analytics isn’t the only tool available for tracking your marketing campaigns, I’m partial to it as it’s free and easy to install and configure.
Here are five reports and tool features you can use to assist you in making data driven decisions.
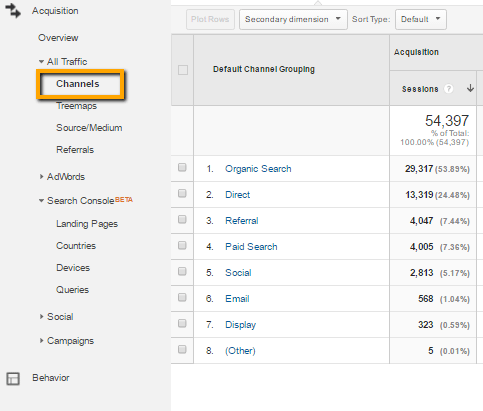
1. Channels
The Channels report provides you with a high-level overview of which online marketing channels are leading to new visitors and leads.

Here’s an overview of a few different channels that can be used to evaluate the performance of your marketing campaigns in Google Analytics:
Direct
These visits are logged anytime a visitor types the exact URL of a page on your website into their browser, or uses a bookmark to access your site. Direct visits can assist you in measuring the overall popularity and awareness of your brand. These visitors are already familiar with your business.
How it’s actionable:
This report is great for evaluating how various marketing campaigns are leading to brand awareness (e.g. did you pay for a radio spot that mentions your homepage URL? Do you have a billboard? Did you send out a flyer?) Measure both online and offline campaign performance by adding an annotation in Google Analytics. Learn more about direct traffic here.
Organic Search
These are visitors that have found your business via a search engine including Google, Yahoo, Bing, AOL or Ask.
How it’s actionable:
Use this report to analyze what pages are receiving organic search traffic and leading to new estimate requests or calls. This report can help you understand how your search engine optimization efforts are improving your business’ visibility and bottom line in organic search. Don’t forget to associate your Google Search Console account so you can view the queries (keywords) that are leading to new organic sessions.
Social
These visitors have come to your site via a social channel including Facebook, Houzz, Yelp, Google+ and more.
How it’s actionable:
While there are many metrics you can use to help evaluate how well your social media marketing strategy is working, one that I find valuable is how many people are clicking through back to your website. Using this metric as a KPI, helps me understand if we’re reaching the right audience and if our sharing and engagement is leading to visits back to our website. Using this report can help you understand where you should be spending your time on social media.
Referral
These visitors have accessed your site via a link on a 3rd party website or blog.
How it’s actionable:
Who is sending you qualified traffic? Have you run an ad, published a guest post, actively contribute to a forum, or have a partner or affiliate that’s linking back to your website? The referral report will help you understand which advertising efforts and relationships are bringing in new leads and sales.
Paid Search
This report shows you how your paid ads on Google AdWords, Bing Ads or other paid search providers are leading to new visitors and goal completions. If you’re running a Google AdWords campaign, make sure your Google Analytics and Google AdWords accounts are linked.
How it’s actionable:
What type of experience are your landing pages providing? Is the traffic converting? If so, from what keywords? Is your PPC campaign acting as a touch point in your customer’s online journey to purchase? Use this report to find out.
2. Goal Completions
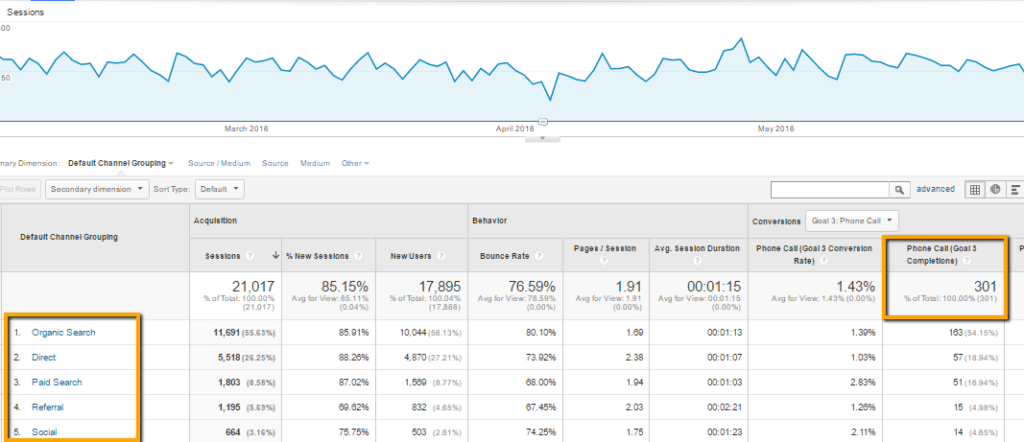
Increasing traffic is only half the battle. Increasing traffic that converts is how you win the war. Tracking all desired visitor actions like estimate requests via form completions, downloads, phone calls, etc. is vital for understanding how well your digital marketing campaigns are working.
To track these interactions I set up a goal, which allows me see who’s converting and from what channels. To track phone calls, Congruent Digital uses CallRail, a dynamic call tracking solution that easily integrates with Google Analytics.

3. Mobile
With mobile searches surpassing desktop searches in Google last year, having a website that’s optimized for mobile visitors is essential. In a recent Google Performance Summit, AdWords execs shared some surprising statistics including:
- There are now trillions of searches on Google.com and over half of those searches happen on smartphones
- Nearly one third of all mobile searches on Google are related to location
In Google Analytics, view your mobile visits by either using the left navigation option and selecting Audience > Mobile > Overview or use the advanced segment option to filter for mobile visitors only. When viewing these reports, questions to ask are:
- How does the time on site, bounce rate, and goal completions compare with desktop visitors?
- Is contacting us easy on mobile devices (do you have a click-to-call feature?)
- Are your forms mobile friendly?
Google just updated their existing mobile ranking algorithm which is supposed to provide an additional rankings boost to websites that are mobile friendly.
Not sure if your website is mobile friendly? Try Google’s free Mobile Friendly Test tool here. You can also use the free tool Screenfly to see how your website appears across multiple devices.
4. Location

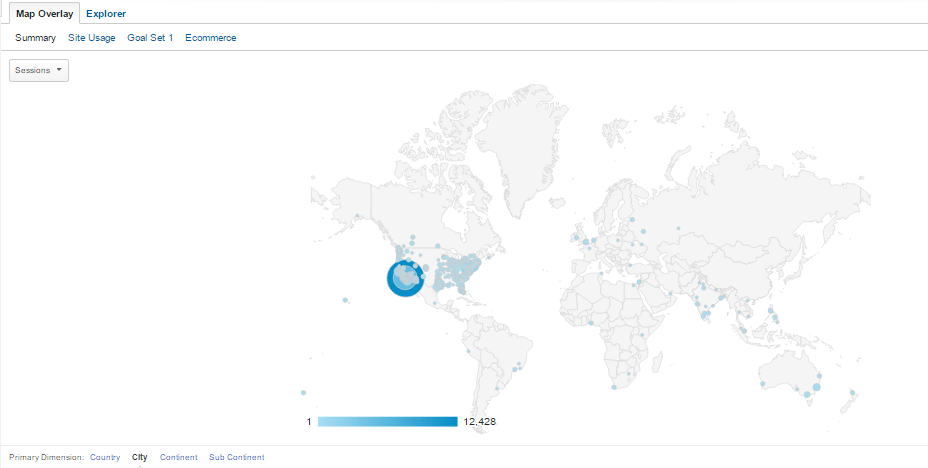
Understanding how to segment and filter your data by location can make it more insightful. While not a hard and fast rule, typically traffic from outside of your service area won’t convert and can skew important metrics in your Google Analytics reports.
Also, getting tons of traffic from a blog post is great, but if it’s not coming from your local service area, in my experience chances are slim it will lead to new business.
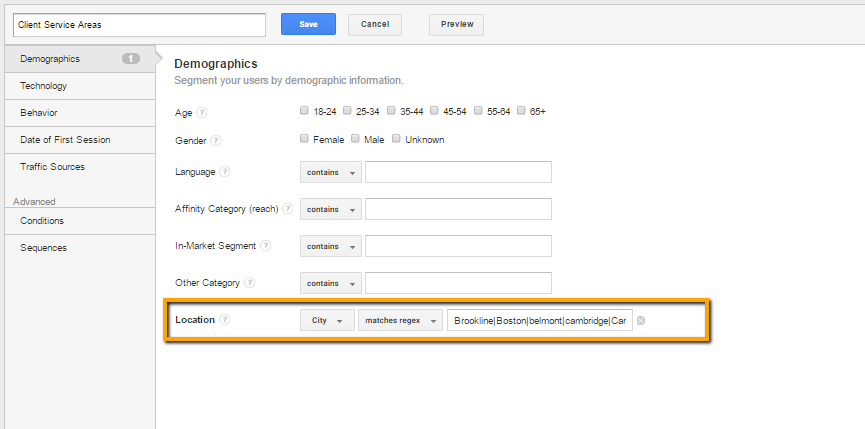
Tip: set up an advanced segment or filter to help you understand which channels are leading to new visitors from the cities and towns from your service area. Make sure you are localizing your landing pages so that you’re sending clear signals to search engines about the cities and towns that you serve.

5. Landing Pages
Channels aside, regardless of how a potential customer finds you online, the experience your landing pages provide is crucial to acquiring new leads. A landing page is defined by Google Analytics as the first page a visitor views during a session – also known as the entrance page. If your website’s landing pages are providing a poor visitor experience, you’ll be wasting money paying for advertising and marketing services.
You can find the Landing Pages report by navigating to Behavior > Site Content > Landing Pages. Important metrics to look at when evaluating the experience you’re providing visitors are:
- Bounce Rate: Bounce rate is defined as a session that only visits one page. A high bounce rate, a low session duration, and no goal completions can all be red flags
- Avg. Session Duration: this metric is defined as the total duration of all sessions (in seconds) / number of sessions. If you’re avg. session duration is low, it could indicate visitors aren’t quickly finding the information they are looking for
- Goal Completions: a goal is any desired visitor interaction. While the online path to purchase can often span multiple sessions as your customers do research, if you’re doing a good job of explaining who you are, what you do, and why you’re a better solution than your competitors, eventually potential customers will want to talk.
Wrapping it Up
Whew, that’s a lot and I’ve only scratched the surface of the reports and features available in this powerful tool. Having data that’s actionable is worth its weight in gold.
If you have questions about implementing anything I’ve mentioned, or would like to learn more about Congruent Digital’s online marketing services, you can email me here. I look forward to learning more about your business!


I understand this blog wasn’t meant to get too technical, but I think it’s important to point out some of the discrepancies when viewing these reports. For example, the Groupon experiment from a couple of years ago (http://searchengineland.com/60-direct-traffic-actually-seo-195415) that showed a high percentage of “Direct” visitors are actually coming from the “Organic” medium.
With skewed data like this, it’s sometimes hard to have exact numbers, but this post is perfect for helping people sort through the data and take action!
Tyson, great to hear from you. It’s probably also worth noting this discrepancy may impact other channels beyond organic.
To the best of my knowledge, there’s no clear resolution to the issue, and unless you’re prepared to deindex your website and run advanced tests, there’s no way to evaluate how this discrepancy could be affecting your data.
As with any cookie based click-stream analysis tool, what we are really viewing are trends. However, by segmenting and filtering data, users can still glean actionable insight from these reports. Thanks for the comment!
Thanks for the info, Brian. We’ve been trying to crank up our local SEO efforts for organic leads and these tools should certainly provide some great assistance! Thanks again!
Thank you Nathan, I’m happy you found the post useful!
Curious to hear your thoughts, Brian, on which marketing channels you believe work best for those of us in the painting industry? Facebook / Facebook Advertising seems to be on the brink of explosion and I’m feeling like I should ride the wave early before it becomes like Google AdWords.
Great post! Excited to hear your thoughts!
Christian, great question and thanks for the feedback on the post!
In my experience Google organic search, Yelp and Google AdWords all seem to consistently drive new qualified leads for painting contractors. However, every business is unique and you may find that local advertising, Houzz, Angie’s List, Porch or even Craig’s List works to bring in new leads.
If you’re planning on starting a paid Facebook campaign, make sure to install the Facebook pixel on your website which will allow you to remarket to those who express an interest in your services by clicking your ad and visiting your website.
Facebook’s resource on how to set up a tracking pixel: https://www.facebook.com/business/help/952192354843755
Also, you know your target audience better than anyone, so make sure that this translates to the audience you set up in Facebook. This can include your service areas, demographics (age) and psychographics (interests). You’ll need users to retarget to, so try a few different promotions over the course of a month to see what’s resulting in the highest engagement.
Lastly, make sure you have proper tracking in place. This can include Facebook’s custom conversions, or something as simple as tagging your campaign URLs so you can differentiate between paid and organic Facebook traffic in Google Analytics.
Facebook’s custom conversion resource: https://www.facebook.com/business/help/780705975381000
Google’s URL Builder: https://support.google.com/analytics/answer/1033867?hl=en
Hope this helps! Feel free to reach out with any other questions.